Every number hides an assumption – and those assumptions are often more optimistic than reality permits. It’s important to have partners who provide security.
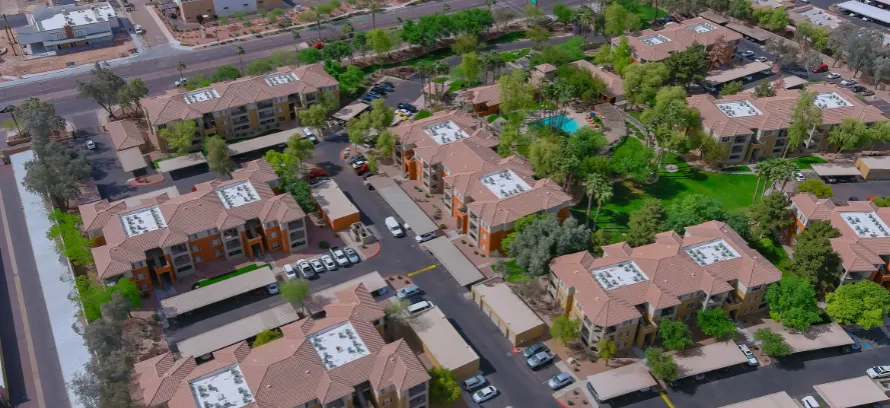
A sponsor pitched a seemingly attractive multifamily project in a growing US market to one of our capital partners.
The ask: provide equity.
The challenge: it was the capital partner’s first project of this scale – and he did not want to rely solely on the sponsor’s materials. We were asked to conduct an independent investment review.
Goal of the review: a well-founded, neutral assessment. Are the assumptions sound? How reliable is the business plan? And above all: how realistic are the promised 17% IRR – the internal rate of return over the full holding period, discounting future cash flows back to today’s value?
1. The exit cap rate - The silent game changer
When a property is sold after a few years, the key question is: at what price will a buyer be willing to acquire it?
The decisive metric here is the exit cap rate. In essence, it represents the “market yield” a buyer demands for the asset at the end of the holding period. You can think of it as the “market interest rate” that a buyer expects for this property at the end of the holding period. The logic is straightforward:
Buyers weigh a property’s annual net operating income (NOI – rental income minus operating expenses) against the return they deem adequate for the associated risk.
A low exit cap rate means buyers are content with a lower return and will therefore pay a higher price. A high exit cap rate means they demand more yield – and will only agree to a lower purchase price. If the exit cap rate is high, buyers demand a higher return – and are only prepared to pay a lower price.
What does this look like in practice?
Assume a property produces USD 2 million in NOI – the annual operating result before financing and taxes – at the end of the holding period.
– At a 5% exit cap, the valuation is: USD 2 million / 0.05 = USD 40 million.
– At a 6% exit cap, it drops to: USD 2 million / 0.06 = USD 33.3 million.
The cap rate is therefore a direct reflection of perceived risk.
Low cap rate: Buyers view the property as safe and stable – prime location, creditworthy tenants, predictable cash flows. As a result, they accept lower yields and pay more.
High cap rate: Buyers perceive higher risk – weak location, elevated vacancies, uncertain rent dynamics. Accordingly, they demand higher yields and accept only lower prices.
The takeaway: a shift of just one percentage point can wipe out nearly USD 7 million in sales proceeds – enough to drag an IRR from double digits into single digits.
The reality in 2025
According to CBRE, national underwriting averages for core/value-add are currently around 4.96% (core exit) and 5.38% (value-add exit)[1]. At the same time, JLL shows that average cap rates have risen from around 3.8% to over 5.6% since 2021[2].
For selected markets and properties with a value-add strategy – i.e. properties that first need to be improved through renovations and active management – exits in the mid-6s are plausible. This is precisely where the leverage effect lies.
Our practice: We take the entry cap rate at the time of purchase and add 0.25 to 1.0 percentage points for the exit as a precaution. In addition, we calculate various scenarios in small steps of 0.25 percentage points. This makes it clear how strongly even small market changes influence the return.
Anyone who does not critically challenge the exit cap is ignoring reality.

2. Rental growth: Wishful thinking is no substitute for analysis
A frequent weakness in underwriting models is overly optimistic rental growth assumptions. In this case, a flat 4% annual increase was assumed – every year, across the entire holding period.
Across the U.S., apartment rents are currently edging up only modestly – roughly one percent per year on average. Florida, however, presents a more robust picture:
Markets like Miami, Jacksonville, and Tallahassee are seeing meaningful rent growth, fueled by sustained population inflows and strong demand. Yardi reported +0.7% year-over-year nationwide for July, while Apartments.com reports +0.9% Y/Y[3][4]. Forecasts for 2025 assume around 2-2.5%[5]. Markets like Chicago and Columbus remain resilient, while Austin, Denver, and Phoenix face supply pressure.
Anyone who nevertheless wants to achieve sustained rental growth of 4% needs evidence: a clear CapEx strategy – investment in upgrading and refurbishment -, truly comparable properties (comps) and a realistic letting path.
Anything else is hope – not strategy.
3. Class A in the calculation - Class B in reality

A closer review of the pitch deck revealed another weakness: almost all rent comparisons were drawn from Class A projects, while the target property was clearly a Class B asset.
Class A properties – new, high-quality, with premium finishes – command very different rents than Class B assets, which are solid but not premium. Applying Class A values to a Class B property is a distortion of the math.
When using comparable properties (“comps”), they must genuinely align with the asset being valued – same location, similar finishes, and comparable quality.
This is precisely what major financiers like Freddie Mac require: an older building in a peripheral location cannot be benchmarked against a new building in a prime location if rental or price assumptions are to be credible[6]. Anything else amounts to whitewashing.
4. Stabilization? Not a chance

A core element of any value-add strategy – portfolios undergoing active upgrades – is the transition phase. This period involves accepting vacancies, renovating units, and realigning tenant profiles.
This phase was entirely disregarded in the pitch. The financial model assumed instant full occupancy and stable cash flows – as though there were no renovations, no vacancies, and no rent concessions such as “one month free.”
The reality is different: According to RealPage, around 12 % of stabilized units offered concessions in summer 2025, an average discount of 9.3 %, i.e. almost one month’s net rent[7]. Such effects must be factored in, otherwise liquidity bottlenecks will arise in the first 12-24 months after takeover.
Anyone pursuing a value-add strategy must also model for value-add realities.
5. Cash Reserves too low

A sound financial plan requires adequate reserves – both for operations (OPEX buffer) and for renovation risks (CapEx contingency). In this case, both were set far too low.
Operating reserves were limited to only three months of expenses – far too narrow for a project facing major refurbishments and reletting phases.
Market benchmarks are typically 3–6 months of OPEX (including debt service), and often higher depending on the property’s age, location, and scope of renovation[8].
The CapEx contingency was set at only 5% of renovation costs. In practice, a double-digit buffer of 10–15% is considered standard to cover rising construction costs and potential rework[9].
Replacement reserves – annual maintenance funds per unit – were also set too low. Fannie Mae requires at least $250 per unit annually[10]. Anything below that is operating on the margin.
Reserves are not a yield drag. They are insurance against the unexpected. The only positive aspect here: the fixed financing rate at least shields the project from interest rate volatility.
What the sensitivity analysis showed
With more realistic assumptions – moderate rent growth, conservative exit cap rate, adequate reserves, and realistic stabilization – the IRR dropped into the single digits. In stress scenarios – slower lease-up, an exit cap rate 50–100 basis points higher, or CapEx overruns – the IRR even turned negative. That alone does not necessarily kill the deal, but it fundamentally reclassifies the risk profile.
Our verdict

Not an automatic no – but a clear warning: invest only with open eyes.We advised the capital partner to treat the project as a high-risk, low-teens case – meaning an investment with elevated risk and a realistic return expectation of just 10–12%.
Three factors are crucial:
- Trust in the sponsor’s integrity and competence
- Confidence in the market and its long-term potential
- The investor’s own risk tolerance and return expectations
Anyone who answers these three questions honestly is not investing in hope, but in cash flow.
What do we learn from this?
- Sensitivity analyses are essential. Investors who fail to test different scenarios for exit cap rates or rental levels are effectively flying blind.
- Rental assumptions and comparable properties are often overstated. This is precisely where a critical review of the underlying data is most valuable.
- Pitch decks can be dazzling. What appears convincing in slides often fails under real-world scrutiny.
- A solid grasp of structuring, underwriting, and financial modeling is vital to avoid being misled by attractive but unrealistic figures.
An objective second opinion can fundamentally shift the view of an investment. For our client, this review turned out to be both a deal breaker and a reality check.
Ultimately, it proved worthwhile to challenge assumptions consistently before committing capital.
If you are seeking an experienced second opinion on your investment, we invite you to reach out to us.
Sources
- CBRE, Multifamily Underwriting Metrics Improve in Q2, July 2025
- JLL, Cap Rate Trends US Multifamily, Q4 2024
- Yardi Matrix, National Multifamily Report, August 2025
- Apartments.com / CoStar, Rent Trends July 2025
- RealPage, Mid-Year 2025 Apartment Market Update
- Freddie Mac, Multifamily Appraisal Guidelines, 2025
- RealPage, Concessions Update Q2 2025
- RealPage, Summer 2025 Stabilization Report
- AACE International, Cost Contingency Development Recommended Practice, 2025
- Fannie Mae, Multifamily Guide – Replacement Reserves, 2025