There are three numbers that determine the success or failure of a multifamily investment – and yet they are rarely highlighted in presentations, podcasts, or whitepapers: Absorption, Units Under Construction, and Job Growth.
Investors who understand and consistently track these three metrics hold a decisive advantage. Those who ignore them risk losing millions – especially in today’s high-interest environment.
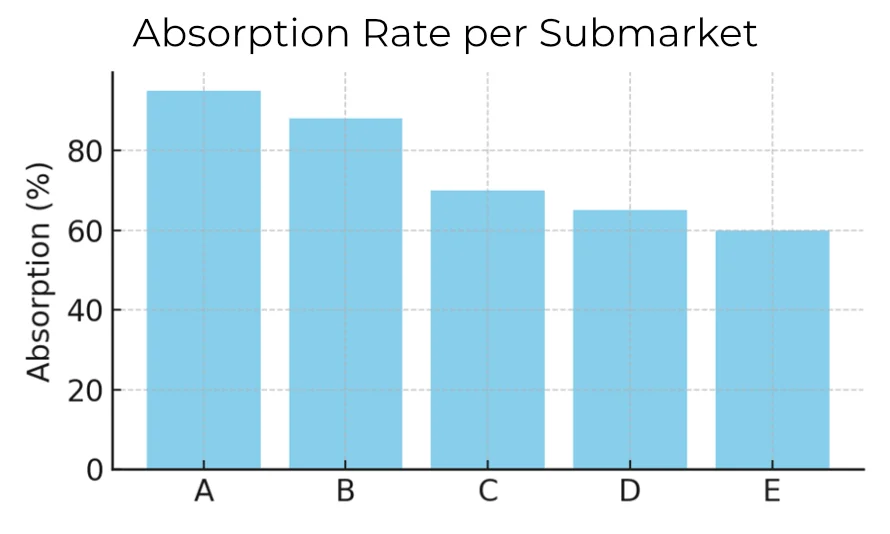
1) Absorption - real demand, not just construction activity
Absorption measures the net increase in occupied units – how many apartments were actually leased, after accounting for both new leases and changes in vacancy. It reflects true demand, not just activity on construction sites.
A healthy market absorbs new units within eight months, often without heavy concessions. In weaker markets, the same process can take 16 months and require two months of free rent. That is the difference between surplus and profitability.
Market momentum has returned in 2025: According to CBRE, net absorption in Q2 2025 reached approximately 188,200 units, while the national vacancy rate dropped to 4.1%. Remarkably, all 69 tracked metros recorded positive absorption. Meanwhile, completions stood at just 83,000 units – well below the number absorbed. This imbalance is stabilizing the market.[1] [1]
But absorption varies widely – not only across metros, but even within submarkets. In Tampa, for instance, only 5 of 13 submarkets currently show stable absorption. In the other eight, a single 200-unit project can tip the balance and trigger rent declines.
2) Units Under Construction – Tomorrow’s Supply
Units under Construction represent the apartments currently being built – the pipeline of future supply.
Today, data providers such as CoStar, Yardi or RealPage can accurately forecast how many new units will be completed in a submarket within the next 24 months[2]. This visibility allows investors to identify supply waves in advance and assess their likely impact on rents, vacancies, and absorption.
After the 2024 peak, the pipeline is cooling down: 572,600 units were still under construction in Q2 2025 – well below the high of around 760,400 (Q1 2024)[3].
For practical underwriting, this means: anyone evaluating a value-add opportunity should not only look at today’s rents, but also at the completions scheduled locally over the next 12–24 months. A declining pipeline supports stabilization – but in markets with elevated construction activity, concessions and slower lease-ups are likely.
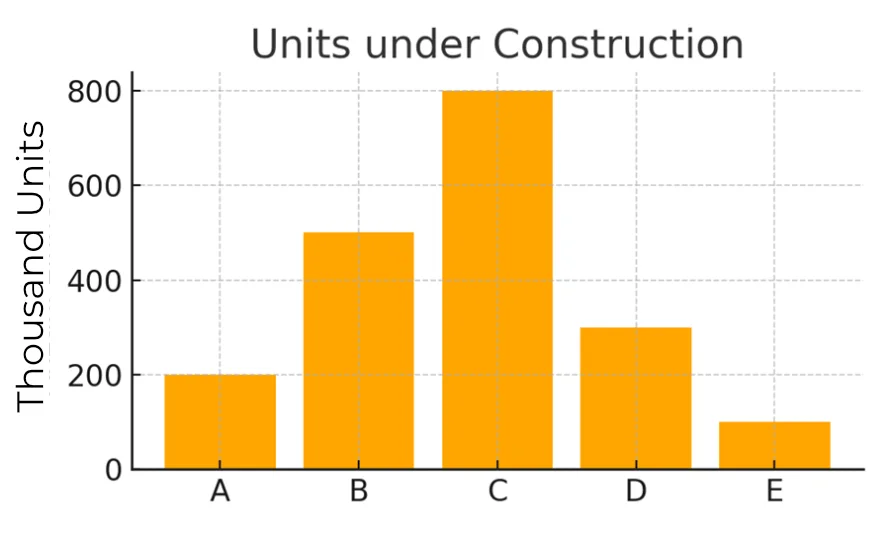
A submarket may show strong absorption today – but if 3,000 units are scheduled for delivery two years out, the outlook can change dramatically.
Without this forward view, investors leave themselves exposed to negative surprises.
3) Job Growth – The Foundation of Household Formation
Job growth is the fundamental driver of household formation – and thus of housing demand. As long as a region consistently creates new jobs, it attracts people who need places to live.
Nationally, the Bureau of Labor Statistics (BLS) reports only modest growth of around +73,000 jobs for July 2025[4]. Florida, however, continues to outperform: metros such as Miami, Orlando, and Tampa are still posting robust employment gains.
The connection is straightforward: sustained job growth leads to household formation, which in turn absorbs new housing supply. According to the U.S. Census Bureau, renter households increased by approximately 848,000 in 2024, while 608,000 new multifamily units were delivered in the same period[5].
This explains why demand is keeping pace in many places , even with high waves of completions. For investors, job growth is therefore the most resilient fundamental indicator in the multifamily sector.
Markets with a stable employment base can digest higher levels of new supply. Markets without this support quickly face pressure on rents and returns.
But job growth alone is not enough.
Only when considered together with absorption and units under construction can investors see whether demand is sufficient to absorb future supply.


Why the Combination Matters
Looking at a single data point in isolation is misleading. True insight comes only from combining the three: absorption, construction, and employment. These lines intersect – and only when read together can they reveal whether a market is balanced or vulnerable.
Our practice is to place these series side by side each quarter, using local data, and to run sensitivities on lease-up velocity, concessions, and exit assumptions. This approach not only shows the current equilibrium but also tests the resilience of future scenarios.
Take Florida as an example: Miami currently shows robust absorption – new apartments are leasing quickly. At the same time, construction volumes remain elevated, with thousands of units in the pipeline.
The decisive factor is employment: the state added above-average job growth over the past twelve months, driven by services, healthcare, and tourism.
This creates households that can absorb the new supply.
Elsewhere in Florida, conditions are less uniform. In Orlando, deliveries remain high, but absorption is weaker and employment growth less diversified – a setup where rents and returns are more likely to come under pressure.
Only by linking all three metrics can investors form a reliable judgment. High absorption alone can be misleading if new construction is excessive or job growth stalls. Conversely, even heavy supply can be absorbed if household and job growth remain strong.
For investors, this means that anyone valuing markets must analyze the dynamics between demand, supply and economic fundamentals in context – anything else would be speculation.
Conclusion
Growth alone is not enough. Absorption shows whether demand is present today. New construction reveals how tomorrow’s supply will affect the balance. Job growth determines whether the market has momentum beyond tomorrow.
Investors who consistently connect these three lines are not betting on hope – they are underwriting durable cash flow and securing a measurable edge in the market.